-
load the library ggplot2, if you have not installed it yet - install it via install.packages("ggplot2")
-
create the example data frame
-
map it to the plot
x <- rep(1:20,20)
y <- rep(1:20, rep(20,20))
z <- rnorm(400, mean=0, sd=15)
df <- data.frame(x=x,y=y,z=z)
ggplot(df, aes(x=x,y=y, fill=z)) + geom_tile()
-
now we can change the colors (colorchart) by add a scale_fill_gradient(low="green", high="red")
ggplot(df, aes(x=x,y=y, fill=z)) + geom_tile()+scale_fill_gradient(low="green", high="red")
-
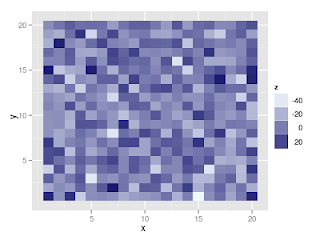
an a second one (with more soothing colors)
ggplot(df, aes(x=x,y=y, fill=z)) + geom_tile()+scale_fill_gradient(low="aliceblue", high="midnightblue")


No comments :
Post a Comment