line types
- again we use the tree data set as example data set
head(trees)
Girth Height Volume
1   8.3     70   10.3
2   8.6     65   10.3
3   8.8     63   10.2
4  10.5     72   16.4
5  10.7     81   18.8
6  10.8     83   19.7
- there are few arguments which control the appearance of lines
- lty line type
- lwd line width and of course
- col color
- lty line type
- first we have a look at lty, one can change the style of the line specifying the type either as a string or the corresponding integer, the default appearance is a solid (or 1), black line:
plot(trees$Girth,trees$Height,type="l",main="lty default ('solid')") ## a default line

- dashed line
plot(trees$Girth,trees$Height,type="l",lty=2,main="lty='dashed' (2)") ## a dashed line

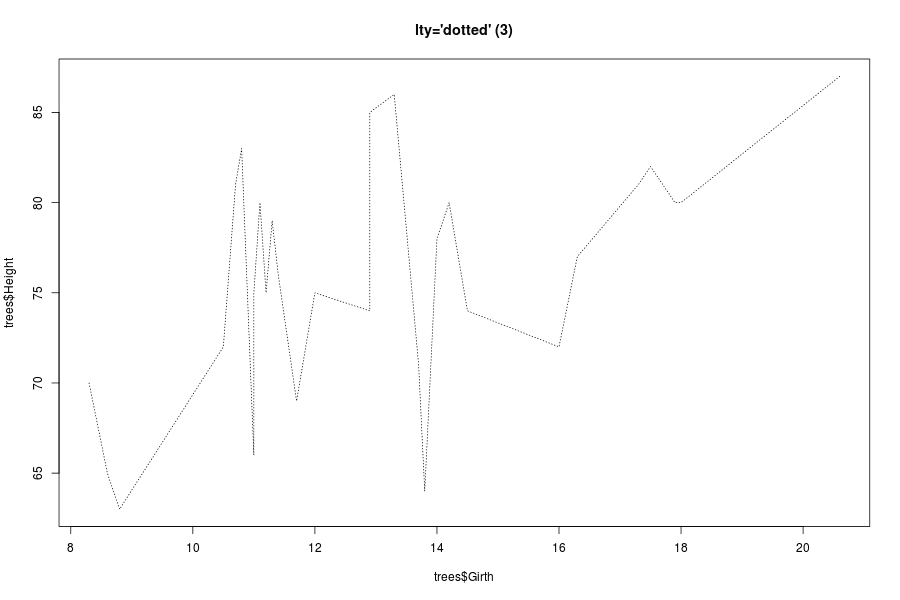
- dotted line
plot(trees$Girth,trees$Height,type="l",lty=3,main="lty='dotted' (3)") ## a dotted line
dot-dash-line
plot(trees$Girth,trees$Height,type="l",lty=4,main="lty='dotdash' (4)") ## a dotdash line

- long dashes
plot(trees$Girth,trees$Height,type="l",lty=5,main="lty='longdash' (5)") ## a long dash line

- two dashes
plot(trees$Girth,trees$Height,type="l",lty=6,main="lty='twodash' (6)") ## a two-dash line

- custom line types
- you can also define a custom line type by specifying a string of length 2, 4, 6, or 8 which consists of non-zero hexadecimal digits
- each digit gives the length of a segment, alternatively drawn and skipped
- the unit of these segments are proportional to the line width (defined by lwd)
- here are some examples:
- a long line (15 units) followed by short off (4 units) followed by 3 units on, off, on, off; once with default line width and once with lwd=4
- a long line (15 units) followed by short off (4 units) followed by 3 units on, off, on, off; once with default line width and once with lwd=4
par(mfrow=c(1,2))
plot(1:10,sample(10),type="l",lty="F43333", main="lty='F43333', lwd=1")
plot(1:10,sample(10),type="l",lwd=4, lty="F43333", main="lty='F43333', lwd=4")

- a line (10 units) followed by 10 units off followed by 5 units on, 2 units off, 5 units on, 2 units off; once with default line width and once with lwd=2
par(mfrow=c(1,2))
plot(1:10,sample(10),type="l",lty="AA5252", main="lty='AA5252', lwd=1")
plot(1:10,sample(10),type="l",lwd=4, lty="AA5252", main="lty='AA5252', lwd=2")

- you can also define a custom line type by specifying a string of length 2, 4, 6, or 8 which consists of non-zero hexadecimal digits


No comments :
Post a Comment